Graphviz (DOT)
- link: Diagrams-as-Code (DaC)
DOT is a plain-text graph description language used to define and visualize structured networks, such as flowcharts, trees, and network topologies. It allows users to describe nodes (the data points) and edges (the connections between them) using a simple, human-readable syntax, which is then compiled into visual diagrams by graph layout tools like Graphviz. Instead of manually drawing shapes and lines, you write the relationships in code, and the software automatically calculates the best way to position the elements cleanly. It is widely used in software development and data analysis for automated documentation, mapping dependencies, and rendering complex data structures.
Tools
- Online Tool: Webgraphviz
Dot Examples
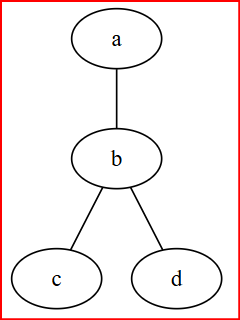
Example 1
graph graphname {
    a -- b -- c;
    b -- d;
}
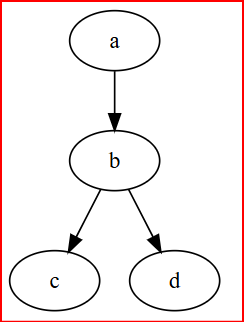
Example 2
digraph graphname {
    a -> b -> c;
    b -> d;
}
Reference
Wikipedia (2026) DOT (graph description language). Available at: https://en.wikipedia.org/wiki/DOT_(graph_description_language) (Accessed: 7 June 2026).
Webgraphviz (2026) Webgraphviz: Graphviz in the browser. Available at: http://www.webgraphviz.com/ (Accessed: 7 June 2026).
Last Updated: 07/06/26